PGconf.SV 2016 and PL/CUDA
I've participated PGconf Silicon Valley 2016 held at the South San Francisco Conference Center.
I could have a presentation here. Its title is PL/CUDA - Fusion of HPC Grade Power with In-Database Analytics.
Its slides are below:
https://www.slideshare.net/kaigai/pgconfsv2016-plcuda/
What is PL/CUDA?
PL is an abbreviation of Procedural Language. In PostgreSQL, we have some PL options like PL/pyhton, PL/R and so on.
This functionality allows to implement SQL functions with different program languages individually.
For example, this SQL function definition is described with "SQL" language.
CREATE OR REPLACE FUNCTION sample(int, int)
RETURNS int
$$
  SELECT $1 + $2;
$$ LANGUAGE 'sql'
We can describe the code block between the $$ marker in SQL-language.
It means we can use other programming language for SQL function definition if another LANGUAGE is given.
So, it is never strange to have CUDA language here.
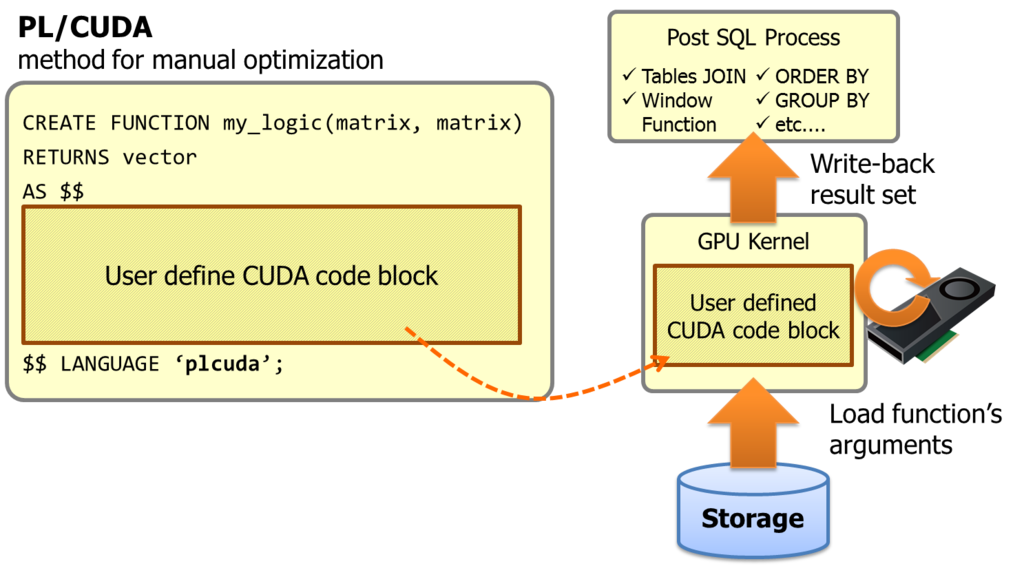
PL/CUDA is a procedural language which supports CUDA code block for user defined SQL function.
It allows to embed a heavy computing portion within a SQL query, and invokes GPU kernels transparently.
As literal, DBMS is database management system. It implies heavy computing is not a primary workload for DBMS, and it is almost correct. So, people who want to run heavy analytic algorithm usually exports the data from the database for more computing performance. However, here is two downsides. The first is network traffic to export the data set. If DBMS would have enough computing capability, all we have to export is results of the analytic algorithm. The other is loss of SQL flexibility on the post-process of the analytic algorithm. If we could finish the algorithm core in database, it is quite easy to join the result with other tables, to make a summary using GROUP BY or window functions.
PL/CUDA is a solution to solve these problems. The code block in the function declaration shall be put into GPU kernel, then PG-Strom's infrastructure build the GPU kernel on the fly and execute on GPU devices with thousands threads. Its function arguments and results are automatically move to/from GPU devices.
Actually, PL/CUDA changes the concept of PG-Strom a bit. It originally intended to accelerate SQL by GPU transparently, thus existing SQL shall be accelerated with no query changes.
On the other hands, PL/CUDA assumes the core logic of algorithm is implemented manually for each use case.
Why we changed this concept? It is based on user's feedback.
Even if we don't need to describe CUDA code, right now, nobody implements complicated analytic algorithms in SQL, thus, it means user has to write up a new code to process them either SQL or CUDA. I'm not certain whether SQL is suitable language for this purpose, and most of known algorithm assumes procedural languages.
So, we thought writing a CUDA code may be a valuable option in some use cases, especially, processing of advanced algorithms. We call this type of GPU utilization manual optimization mode, in contradistinction to the existing automatic code generation from SQL; automatic optimization mode.
Array-Matrix
One other thing we need to pay attention is data-format and memory bus utilization rate when GPU kernel handles the data-format.
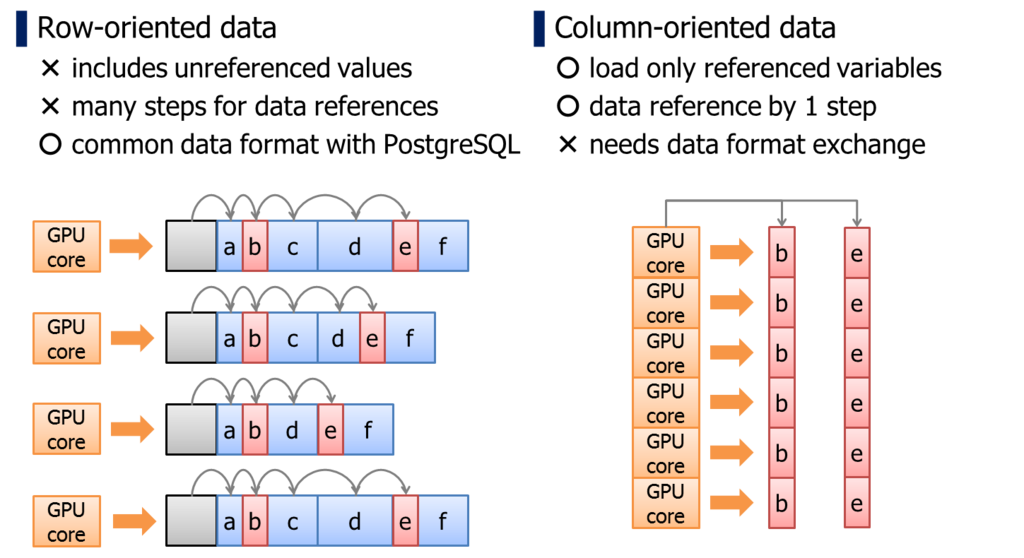
PostgreSQL adopts row-oriented data format. It is an I/O optimal data format for transactional workloads.
On the other hands, it has a downside when we reference individual columns within a record. Because the location of column is not predictable unless reading the record actually, we have to walk on records from the head, thus, it takes larger number of memory access.
It is unignorable penalty when we run a logic on GPU which has relatively smaller memory cache. In case of column-oriented data format, location of the data can be determined uniquely by pointer of the array and thread-id.
In addition, column-oriented data format has an advantage for GPU devices from the standpoint of memory bus utilization rate.
Unit size of GPU's memory transaction is usually 32bytes/256bits. If multiple processor cores requires coalesced memory location simultaneously, these multiple memory accesses are consolidated to a single memory transaction, then, a single memory transaction will load 8 x 32bits variables at once. This scenario pulls up the maximum utilization rate from the memory bus of GPUs; that is much higher than CPU/RAM bandwidth.
When we run a particular calculation by multiple processor cores, it tends to reference same columns simultaneously. Columns are scattered in row-oriented data structure, so it is hard to pull out the maximum utilization rate of memory bus.
However, columnar-format is not always winner. Transformation from row-format to column-format needs extra cost prior to GPU invocation, and it is hard to justify the data transformation cost for usual SQL operations like JOIN, GROUP BY, etc...
One candidate is highly computing intensive workload like advanced analytic algorithm which we will implement using PL/CUDA.
Fortunately, PostgreSQL already has a data-type which is almost equivalent to the column oriented data format. It is array data type, and we call the array data type with no NULLs and consists of fixed-length data type array-matrix.
An aggregate function array_matrix(variadic datatype[]) consumes multiple rows then produce a 2-dimensional array data. Any elements are re-ordered per column, and data location is predictable by the offset and width of the element data type.
We usually call PL/CUDA function with array-matrix arguments.
Usecase.1 - Similarity Search on Drug Discovery
The first usecase I introduced is a similarity search workloads on drug-discovery *1.
First of all, I like to introduce the background of the problem we tackled.
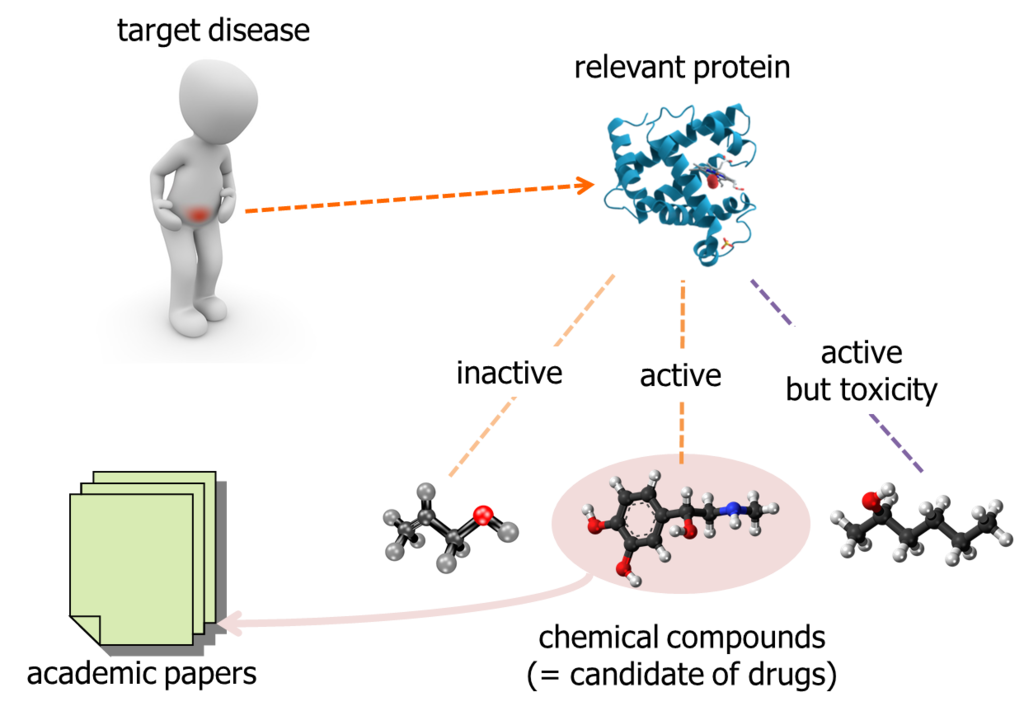
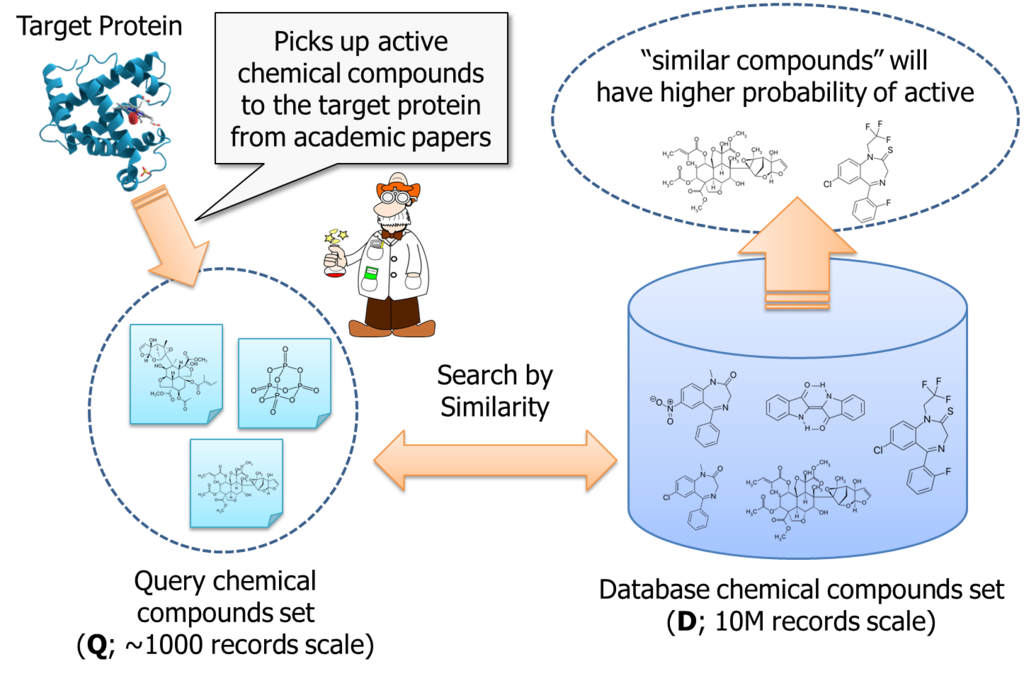
When researcher tried to find out a candidate of new drug, it has to be "active" to the target protein which is related to the target disease. Some chemical compounds are inactive, some other chemical compounds are active but toxicity. Academic papers, daily published by somewhere, report relationship between a target protein and chemical compounds. So, researcher can gather the public data of chemical compounds relevant to a particular protein.
On the other hands, people said the total number of chemical compounds we can obtain as a test reagent and investigate are about 10,000,000. It is too expensive to purchase and test them in laboratory, with brute-force approach. So, researcher is motivated to pick up chemical compounds which have higher probability of active to the target protein.
It is an approach to search "similar" chemical compounds to the known ones; which are already reported in academic papers and etc...
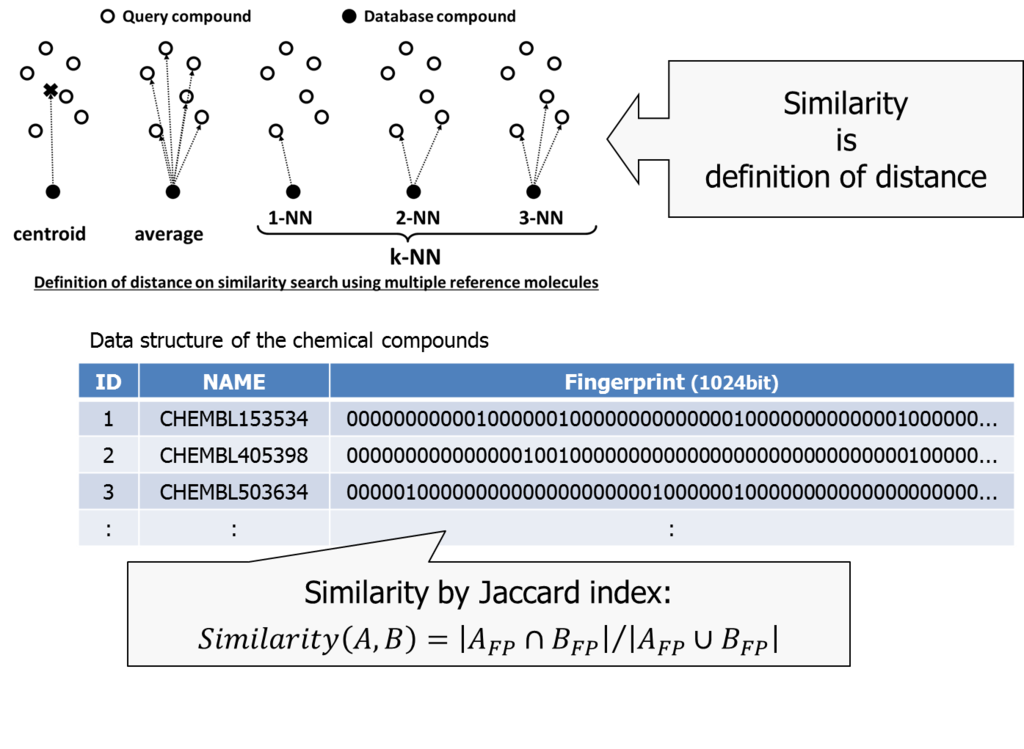
Similarity is to define a distance between two chemical compounds. Euclid distance is one approach usually used to define geometrical distance between two points.
We used a combination of Jaccard index *2 and k-NN (nearest neighbor) method in our trial.
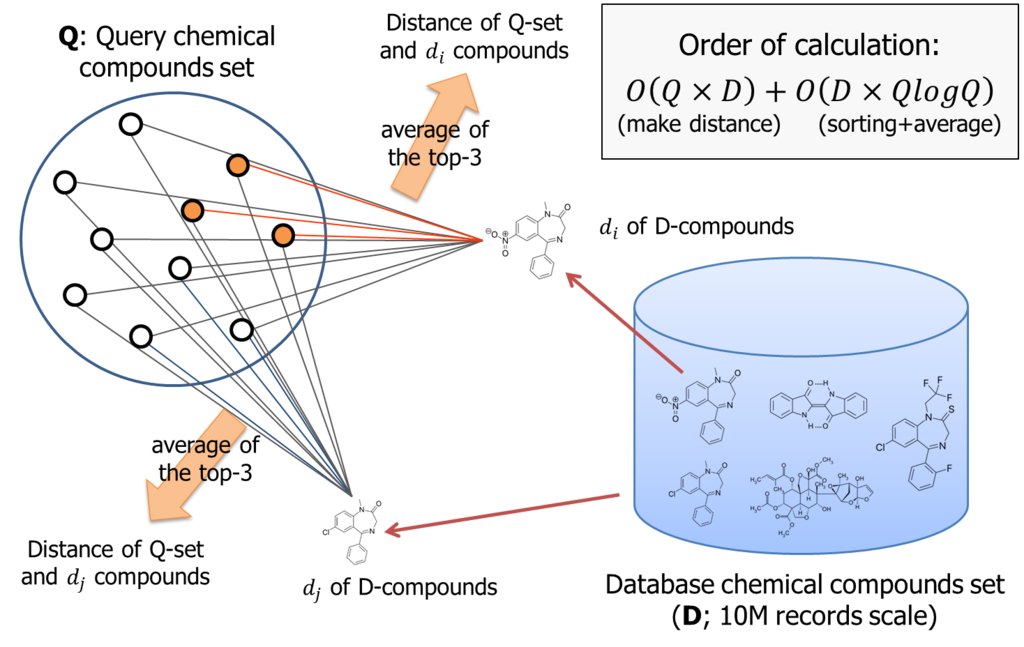
The k-NN method is used to define distance between a set of items and an item. Once we calculate all the distance between items, than picks up the largest k distances and considers its average the representative distance between them.
Jaccard index can be used when characteristics of two items are described in a bitmap. We consider the ratio of bitmap-AND and bitmap-OR as similarity of two items.
According to the logic, if number of query compounds set is Q, we once need to calculate Q similarities for each database item; that is about 10M. Than, these similarity must be sorted for each database item. Thus, total amount of computing order is almost O(DxQ) + O(DxQlogQ).
It is not small. If Q is 1000, we need to handle 10billion combination to process the logic.
The PL/CUDA function we implemented (knn_gpu_similarity()) did nothing special. It once computes the similarity between two chemical compounds by a processor core for each combination, then run the bitonic-sorting to pick up the largest k-similarities.
This PL/CUDA function takes two array-matrix that are constructed from the relation scan on the fly, or statically pre-built.
Once similarity search gets completed, it unnest the matrix to a generic stream of records by matrix_unnest, then processes the results set using usual SQL features (tables JOIN and window function here).
Its performance is quite impressive. We compared to the same logic based on CPU.
In case of the largest query set (1000), it reduces the response time more than x150 times faster.
It may have a power to change the workstyle of researcher. 3,000sec (=50min) is a timescale for batch job. It is too long to wait in from of the workstation. On the other hands, 20sec is scale for interactive operations; which allows try&error on research process.
Usecase.2 - Data Clustring (k-means)
The second usecase is clustering analysis.
k-means is a representative method for non-hierarchical cluster analysis, used for unsupervized learning.
This algorithm tries to get the final clustering with iteration of simple operations.
First, it assigns a cluster for each item randomly as initial state.

Second, makes a centroid for each cluster according to the initial state.
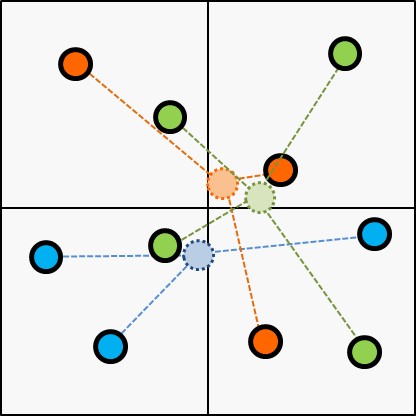
Next, choose the cluster of every items according to the centroid updated on the last step.
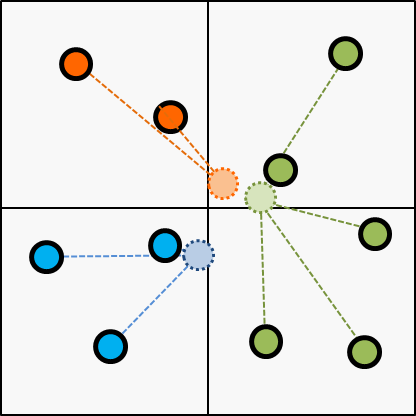
Next, update the centroid according to the latest cluster; updated on the last step.
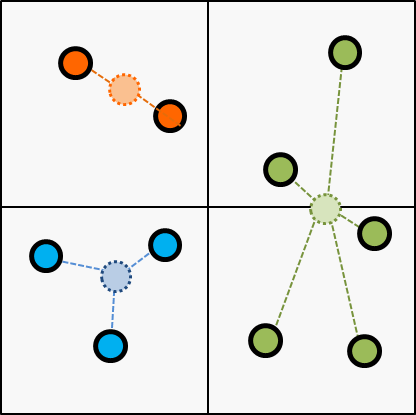
Then, break the iteration if cluster assignment gets converged or reached to the threshold of the iteration.
The data-set we tried to apply k-means() clustering is a collection of city traffic data at Aarhus, Denmark, by the CityPlus project.
iot.ee.surrey.ac.uk
This dataset contains traffic data (car count, avg speed, ...) in 449 observation point all around the city. The total amount of sensor data is 13.5M records.
In this trial, we applied k-means() algorithm on the raw dataset, then make a summary for each observation point. We assumed each observation points belong to the most frequent cluster.
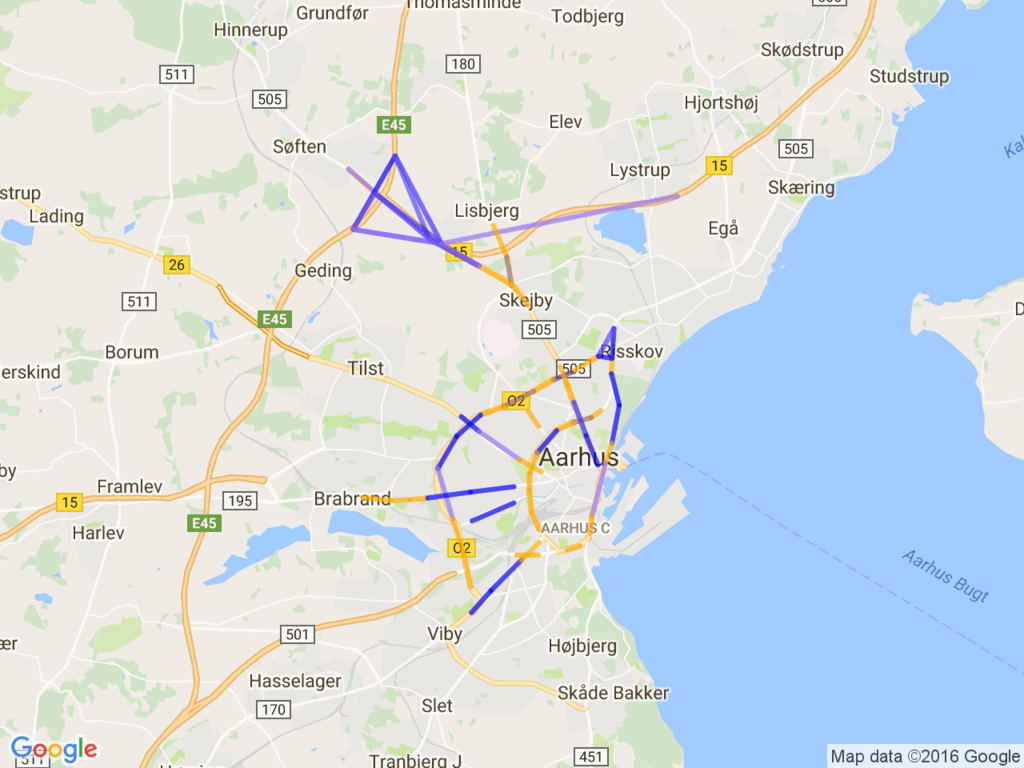
Then, mapped it on the google map using static map APIs.
The result is below:

It looks to me the blue observation points are bypass highway; many car count and high speed.
On the other hands, green line seems to me the way to the downtown, thus many car but slow speed.
I'm not sure the characteristics of the red line, but appears on the beltway frequently.
Because all the clustering calculation is executed inside of the database, it is quite easy to control the input data.
Below is the same diagram when weekdays and weekend.
- weekdays
- weekend
Here is a little difference between them, however, the diagram of weekend categorize the road to the downtown with same color of the highway. So, it has less traffic on the weekend, thus, car speed is higher than the case of weekday.
For the arrangement, all I did is just adding a WHERE clause on the query to kick k-means clustering. Utilization of the SQL flexibility is one of the biggest advantage of PL/CUDA, in addition to the performance benefit.
SELECT report_id, k, c
  FROM (SELECT report_id, k, c,
               row_number() OVER (PARTITION BY report_id
                                  ORDER BY c DESC) rank
          FROM (SELECT report_id, k, count(*) c
                  FROM matrix_unnest(
                        (SELECT gpu_kmeans ( array_matrix(
                                               int4_as_float4(report_id),
                                               avg_measured_time,
                                               avg_speed,
                                               vehicle_count),
                                             5)
                           FROM tr_rawdata
                          WHERE extract('dow' from timestamp) in (0,6)
                        )
                       ) R(report_id int, k int)
                 GROUP BY report_id, k
               ) __summary_1
       ) __summary_2
   WHERE rank = 1;
